


Expert analysis at the intersection of AI, bioinformatics, and genomics.
Breaking down the science shaping precision medicine — from whole-genome sequencing and liquid biopsy to spatial transcriptomics, proteomics, and metabolomics — grounded in peer-reviewed literature and written for the people building the next generation of life sciences products.
The archive now runs to roughly 100 articles. Use the search below to find the ones relevant to your work.
Search the blog by entering the keywords below and hitting “Enter“
Editorial Notice
Disclaimer
What this blog is, what it is not, and the terms on which it is published.
Scope
The content published on this blog by Zetobit LLC is provided for general educational and informational purposes only. It reflects the professional views of the author, Kanna Nandakumar, PhD, and does not represent the views of any current or former employer, client, or institution.
Not advice
Nothing here constitutes medical, clinical, diagnostic, or legal advice. It is not a substitute for consultation with a qualified physician, genetic counselor, or the laboratory that issued a given test result, and it must not be used to make diagnostic or treatment decisions. Reading this material does not create a client, consulting, or professional relationship with Zetobit LLC.
Illustrative content
All report excerpts, figures, variants, and data shown are synthetic or illustrative. They contain no patient data and describe no real individual.
Currency & accuracy
Scientific literature, professional guidelines, and regulatory requirements change. Articles reflect the state of the field as of their publication date and are not updated. While the author makes reasonable efforts to verify claims and cite primary sources, no warranty is made as to accuracy or completeness, and Zetobit LLC accepts no liability for any action taken in reliance on this content.
Last updated August 2026
Questions about this notice — zetobit.com/contact
Where the Wet Lab Ends and Pipeline Validation Begins
CLIA defines a test system as instructions, instrumentation, equipment, reagents and supplies. Software is not on the list, which leaves laboratories to work out for themselves where wet-lab validation ends and pipeline validation begins. The answer is not a file format. It is a moment — lock-down, after which no parameter moves — and a scope statement naming the assay configuration the pipeline's performance was established on. Hand a capture pipeline amplicon data and it discards nearly every read, correctly. What follows is which evidence each side can generate, why in silico data help on only one of them, and what belongs in the file.
What Counts as the Same Event: Validating Copy Number and Structural Variant Detection
A sequence-variant validation can end in a number. A copy number validation cannot, because a CNV call is not one claim — it asserts that an event is present, that it spans roughly these coordinates, and that the copy state is this, and each of those is supported by different evidence and adjudicated by a different comparator. Whichever one the concordance rule happens to score becomes the sensitivity figure. A 2025 clinical benchmark shows the same tool returning 83% and 100% sensitivity depending on how "detected" was defined. That definition belongs in the validation plan, not in the analyst's judgement.
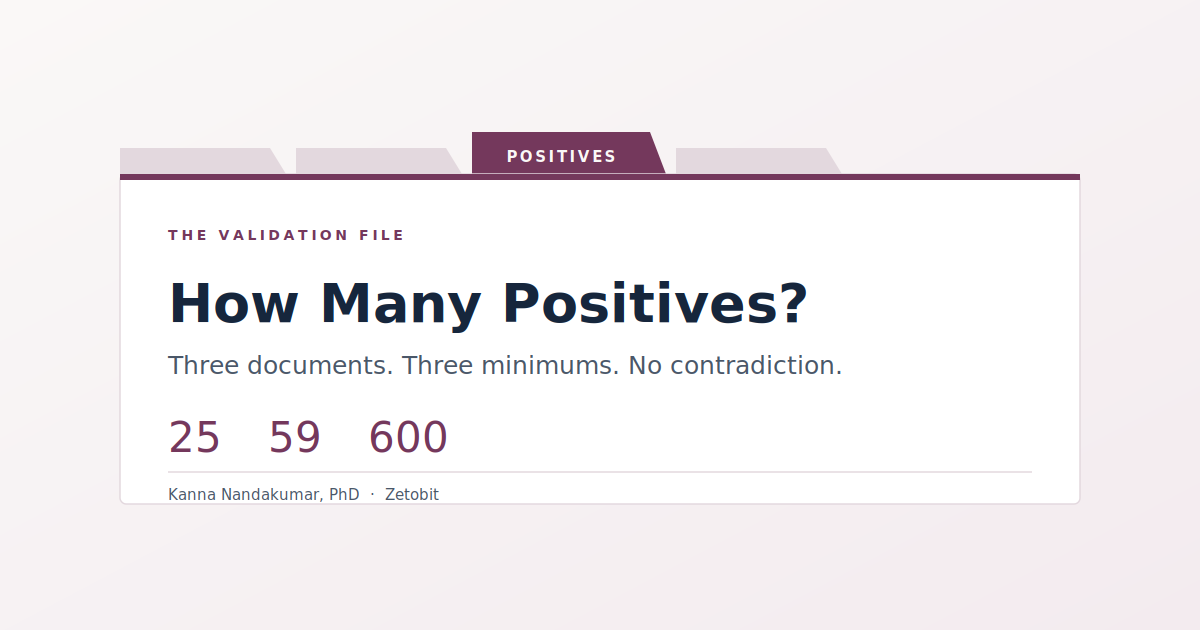
How Many Positives Do You Need: Why 25, 59 and 600 Are All Correct Answers
Ask how many positive samples a validation needs and you'll get three answers: 59, 25, and — from the least-read section of the same document — 600. They don't conflict. AMP and CAP's 59 is a tolerance-interval threshold about your worst future sample, not a sensitivity calculation. New York's 25 is a pre-permit gate. Its 600 is a rolling confirmation program capped at five per gene, which makes the count a coverage requirement in disguise. None of the three lets scarcity lower the bar; each converts a shortfall into a second method, a standing confirmation policy, or a documented in silico set.
Reportable Range Is Not the Gene List
A panel is described as 523 genes. The requisition says 523 genes, and so does the section of the SOP headed reportable range. None of those sentences is a reportable range. CLIA's performance-characteristic definitions were written for quantitative single-analyte tests — the reportable range of a glucose assay is the span of concentrations it measures accurately — and translating that to a method with an unbounded number of targets is a problem each laboratory solves for itself. The translation usually collapses three boundaries into one paragraph: what the assay interrogates, what the validation established, and what the pipeline will actually print. FDA keeps the first two apart in labeling, and asks for a fourth thing most packets lack — the clinically relevant variants that fall outside what the test detects. The third boundary is the one that moves, because it is a number in a config file and a QC outcome that differs specimen to specimen.
What “99.5% Sensitivity” Is a Claim About
A validation study closes and a number appears in the summary: 99.5% sensitivity. Over the following year it travels into a brochure, a scope of work, a data-room slide — arriving intact and stripped of everything that made it true. Three choices were made before it existed. Which quantity is being named: CLIA's "analytical sensitivity" is a limit of detection, a VAF and an input mass, not a rate at all — and if the comparator wasn't a reference standard, FDA says the word isn't sensitivity but agreement, which is not a measure of correctness. What sits in the denominator: when Genome in a Bottle widened its benchmark from 85% to 92% of the assembly, the same short-read call set showed eight times more false negatives. And how many observations stand behind it: 199 of 200 is 99.5% with a lower bound of 97.2%; 995 of 1,000 is 99.5% with a lower bound of 98.8%. Same sentence, different claim.
One Word,Three Obligations
Someone says the assay has been validated. Three different claims hide in that sentence, and they carry different study designs, different sample counts, and different documents at the end. CLIA draws the first line sharply: unmodified FDA-cleared systems are verified, everything else is established — and a sample type not listed in the instructions for use already counts as a modification. The third obligation isn't in CLIA at all. A laboratory can satisfy 493.1253 completely, pass inspection, and hold no documented evidence that a result means what its own report says it means.
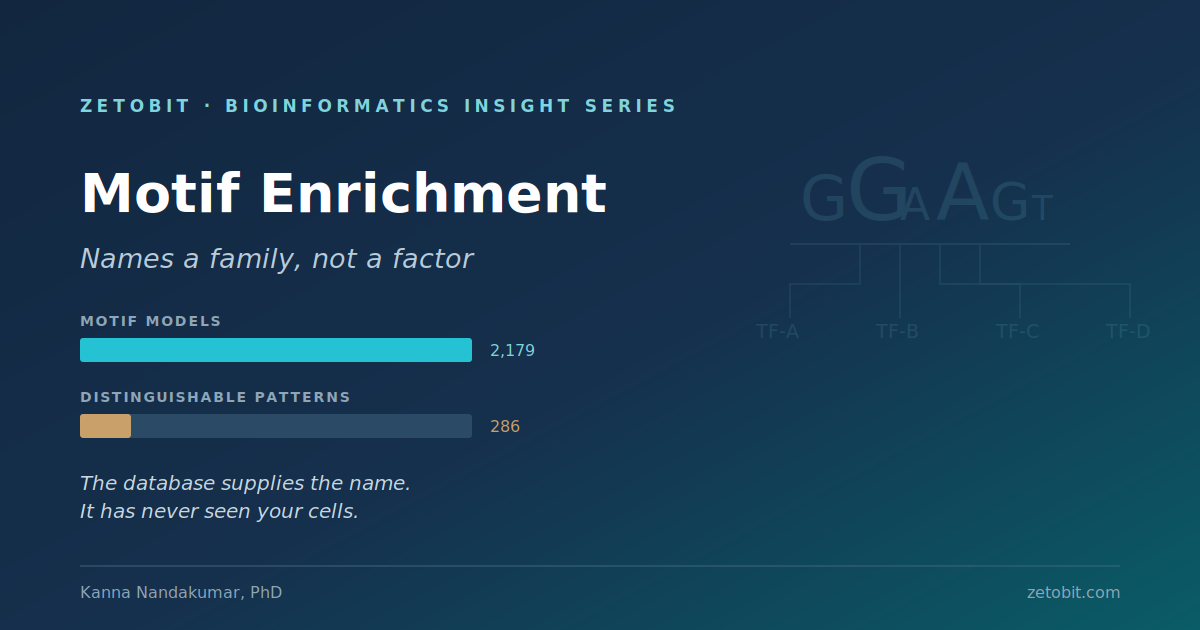
Motif Enrichment Names a Family, Not a Factor
Most accessibility analyses end with a list of transcription factors. What was computed is a list of short degenerate sequence patterns; the protein names arrived from a database. Clustering 2,179 motif models yields 286 distinguishable patterns — so five related factors in a top-ten table are one observation reported five times. The clinching detail is in chromVAR's own paper: the method computes deviation scores for seven-mers, sequence features with no protein attached. If the pipeline works without a factor name, the factor name is a label applied afterwards, not an output of the measurement.
Reading the Handover: Why a VCF Is a Conclusion and a BAM Is an Asset
The analysis finishes, a folder arrives, and everyone signs off. What has just happened is that a decision was made about which questions you are still allowed to ask in three years — usually by whoever decided what to put in the folder. A VCF holds conclusions: the positions where one caller, under one filter set, judged the sample to differ from one reference. It has no way to distinguish "matches the reference" from "never covered." The evidence those conclusions came from is roughly a thousand times larger, and costs about a dollar a year to keep.
Diligence on a Genomics Claim: What to Ask About the Cohort, the Split, and the Endpoint
The slide says the model was validated in an independent cohort of 1,240 and achieved an AUC of 0.89. The number that feels like the evidence carries the least of it. In a time-to-event setting the effective sample is the number of events, not the number of people — and the number of features screened, not the number that survived, governs how easily the result could have been luck. Ask when the held-out set was separated relative to feature selection, and how many model versions have been tested against it since. Ask what endpoint was measured and whether it was chosen in advance.
Reading a Validation Report: What Analytical Validation Establishes, and Why Clinical Validity Is a Separate Document
A validation report describes an instrument, measured against another instrument, on specimens the laboratory assembled on purpose. Its numbers are almost always correct; what is easy to miss is what they are numbers about. CLIA lists the performance characteristics a laboratory must establish, and every one of them is a property of the measurement — CMS says plainly that its program does not address clinical validity at all. Sensitivity is measured against a comparator, not a disease. Predictive values inherit the cohort's prevalence, not your population's. And a flawlessly validated assay can report a correct result in a gene whose disease link does not hold.
Reading a Bioinformatics Scope of Work: What’s In, What’s Out, and What Gets Billed Later
A scope of work is not a description of the work. It is an agreement about who absorbs the surprises — and the boundaries that end up mattering are rarely the ones argued about at signature. Read the nouns rather than the verbs: samples, iterations, artifacts, meetings are countable and enforceable; "analyze" and "interpret" are neither. Then find the three silences that do most of the damage — metadata reconciliation, the gap between delivering a file and defending its meaning, and validation as distinct from execution — and the items that carry a clock: storage, reanalysis, revalidation, and handoff.
“We Ran the Standard Pipeline”: Four Questions That Make That Sentence Mean Something
We ran the standard pipeline is offered as reassurance and usually lands as one, because it sounds like a statement about quality. It isn't — it's a statement about conformity to something nobody has named. Standard according to whom: a validated in-house procedure, a published community workflow, or unexamined habit? Standard as of when — which code version, and which annotation release? Validated on which specimen types and variant classes, and is yours among them? And what did its defaults filter out before a human read anything? Four questions, each with a short answer the issuing laboratory already holds.
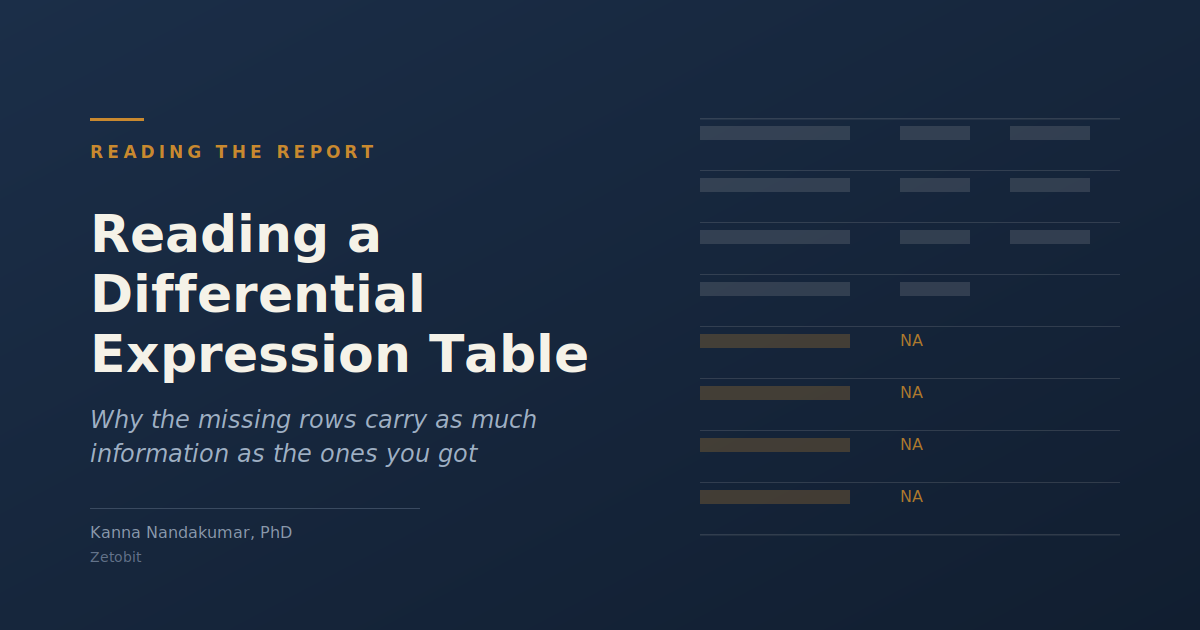
Reading a Differential Expression Table: Why the Missing Rows Carry as Much Information as the Ones You Got
A differential expression table looks like a finished answer: here are the genes that changed. It is something narrower — a ranked list of the genes for which the evidence was strongest, among the genes that were tested, under the comparison that was specified. Sorting by adjusted p-value sorts by measurement quality, not by biological importance. A gene can be missing for four different reasons the file does not distinguish, and the set of genes tested is itself chosen from the data. At three replicates per group, the table is approximately the large-effect subset of the real answer.
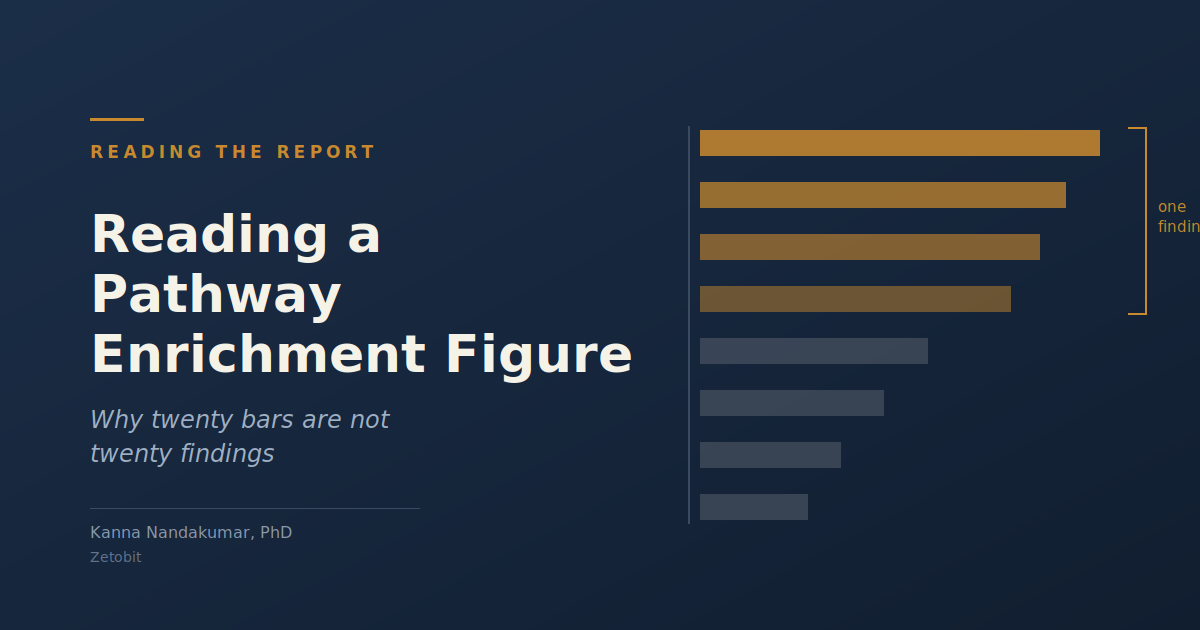
Reading a Pathway Enrichment Figure: Why Twenty Bars Are Not Twenty Findings
A pathway enrichment chart reads like a leaderboard of biological processes. It is a statement about the overlap between two lists, measured against a comparison set the analyst chose and almost never shows. The bars are not independent: nested and overlapping gene sets mean twenty bars can be one finding driven by the same handful of genes. The background list alone can multiply the number of significant terms severalfold — in one worked example, 207 terms became 808. And because the axis plots significance, the most specific and most strongly enriched term is usually near the bottom.
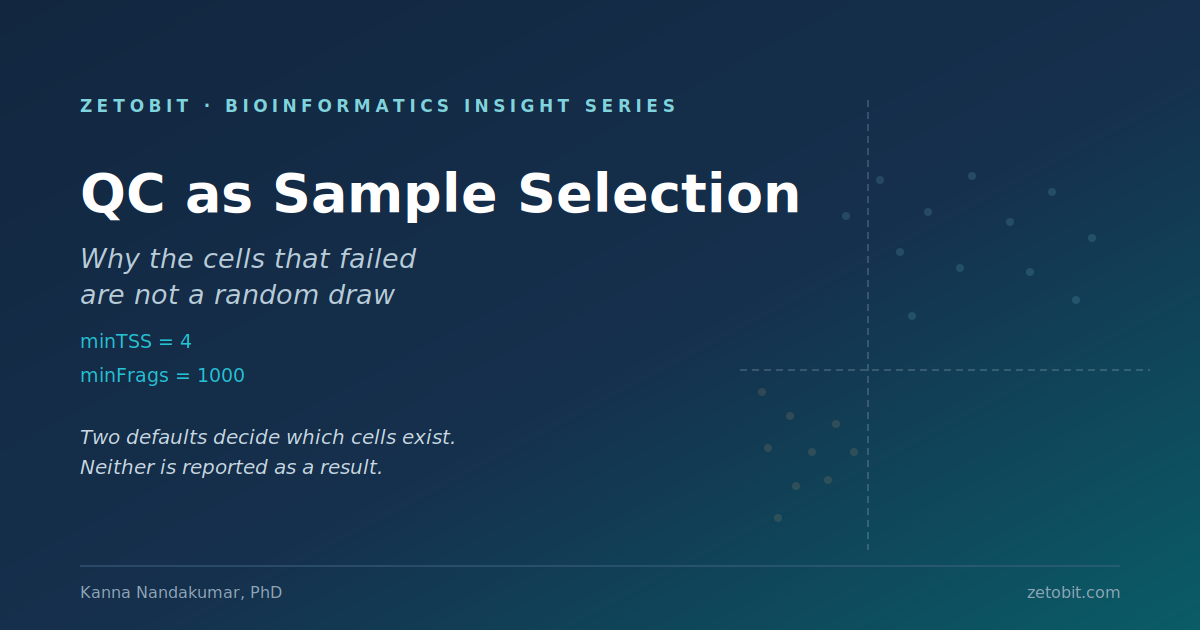
QC Thresholds as Sample Selection: Why the Cells That Failed Are Not a Random Draw
A scATAC analysis begins with minTSS = 4, minFrags = 1000. Everything downstream is conditional on that line, and it appears in the methods as a parameter rather than a result. The scRNA field ran the controlled experiment: adaptive per-cluster thresholds retained a median 95.4% of cells against 69.4% for fixed cutoffs, recovering neutrophils, NK cells, cardiomyocytes and platelets. The decisive finding is the asymmetry — no cluster was unique to the strict threshold. Not one. A filter discarding cells at random would occasionally win. This one only subtracts, and it subtracts by cell type.
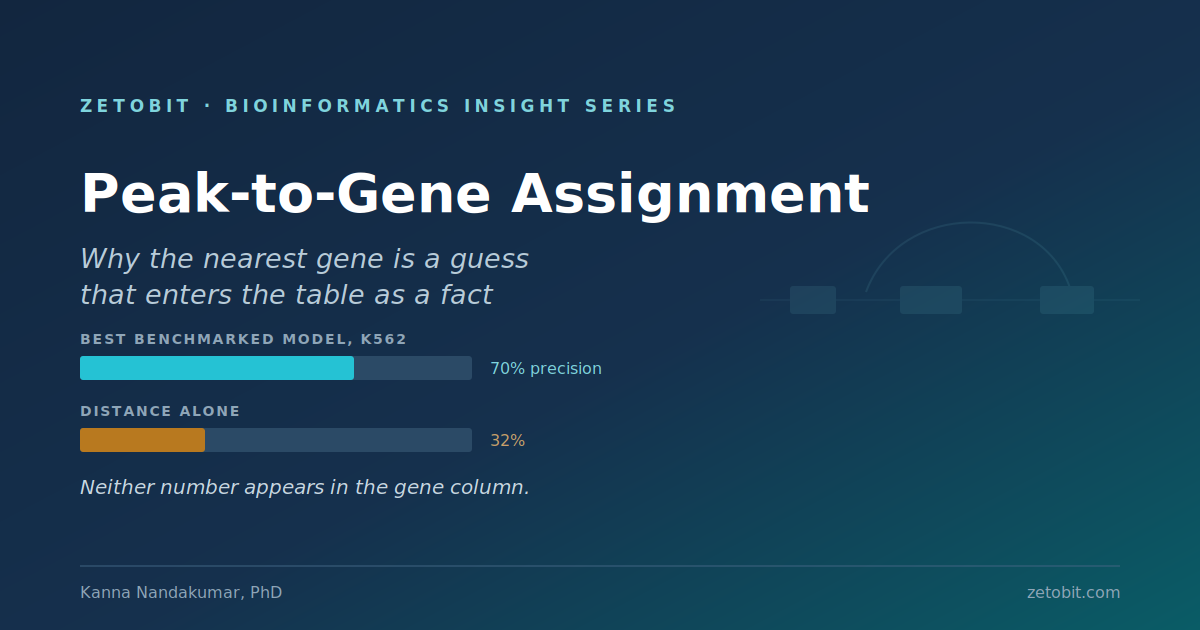
Peak-to-Gene Assignment: Why the Nearest Gene Is a Guess That Enters the Table as a Fact
An ATAC analysis produces coordinates; a report produces gene names. The step between them is usually a default: nearest TSS, or a distance-weighted gene score. It carries no confidence value and no alternative candidate. The received wisdom that enhancers routinely skip genes comes mostly from contact maps; the perturbation data says something different — 86.8% of regulatory interactions fall within 100 kb. The real problem is structural. Among elements regulating more than one gene, 64% did so in mutually exclusive sets of cell types. A gene name computed from coordinates alone assumes the mapping is a constant of the genome. It isn't.
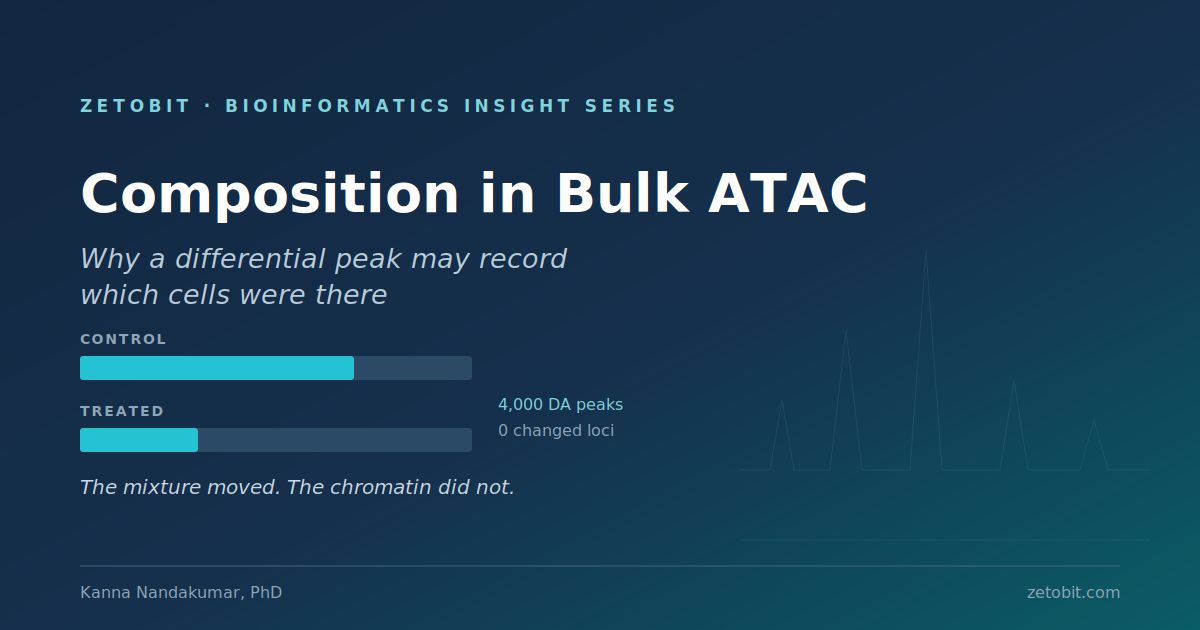
Cell Composition in Bulk ATAC-seq: Why a Differentially Accessible Peak May Record Which Cells Were There
A bulk ATAC comparison returns four thousand differentially accessible peaks with coherent motif enrichment. One reading is that the treatment changed chromatin. A second produces an identical result: the treatment changed which cells were in the sample. The methylation field settled this a decade ago — 63.5% of array CpGs differ across sorted blood cell types, 86.7% of reported age-associated sites showed cell-type differences, and in flow-sorted cells no probes reached significance for age at all. Worse than false positives: when composition-linked sites were removed, the top enriched categories flipped from immune to developmental. The confounder writes its own interpretation.

Sparsity in Single-Cell ATAC-seq: Why a Zero Is a Sampling Outcome, Not a Closed Locus
A scATAC-seq matrix looks exactly like a scRNA-seq matrix — cells, features, counts — and gets the same tools and the same reading, in which a zero means the cell lacks the thing. Accessibility is measured on DNA, present in two copies, and only 1–10% of a cell's accessible peaks are detected, against 10–45% of expressed genes. A model built to find the ceiling reported that more than 75% of peaks carry too little information to say whether one cell is open there — using ground-truth parameters. The zeros then reappear inside the normalization: the first LSI component correlated with library size at −0.95.
What the QC Report Omits
A quality-control summary arrives at the front of the data, and the word at the bottom is "passed." That word carries a precise, bounded claim: the run fell inside the range where this laboratory characterized this assay for this purpose. It is not a score, and it does not travel between labs. Two clinical exome laboratories reported nearly identical coverage — 96.49% and 96.54% of nucleotides at 20× — on top of very different sets of completely covered genes. The average is least informative exactly where readers need it most: when the question is about a short list of genes.
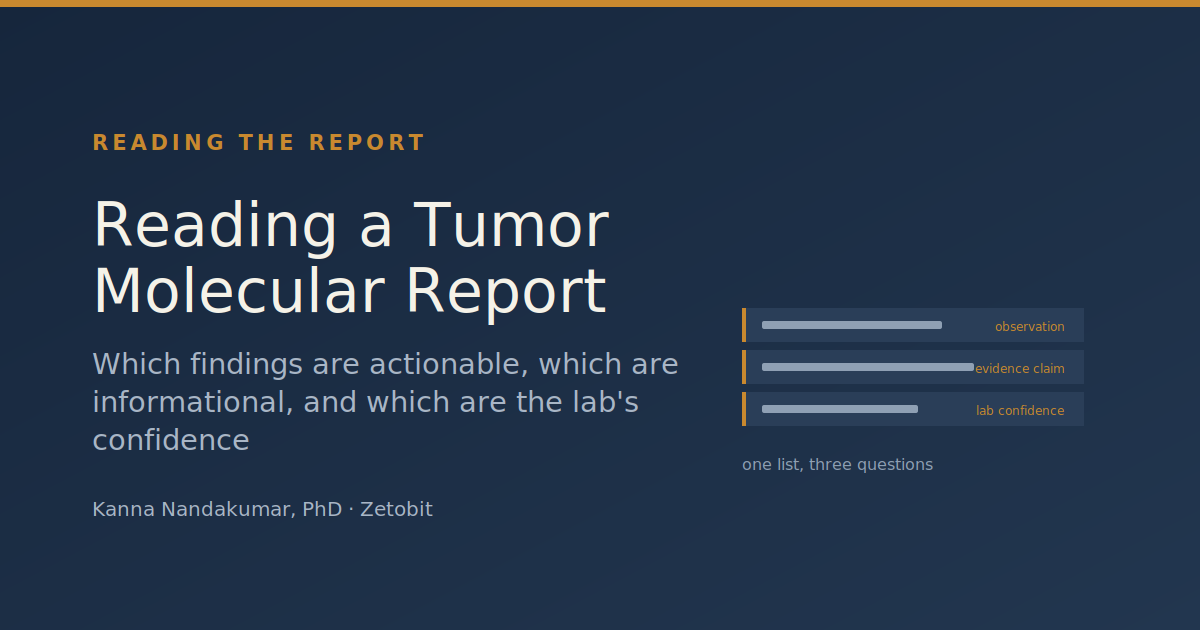
Reading a Tumor Molecular Report: Which Findings Are Actionable, Which Are Informational, and Which Are the Laboratory's Confidence
A tumor profiling report arrives as one ranked list with a column of drug names beside it, and the eye stops at the first row with a therapy attached. But the entries answer three different questions. Some describe what is in the specimen. Some describe how much published evidence connects that finding to a drug — in this tumor type, not in general. And some describe how confident the laboratory is that it saw what it says it saw. Those three claims have different failure modes and different shelf lives, and they are printed in the same typeface, in the same table.